Golden Whistler
Pachycephala pectoralis
ABR description
The following is extracted from the Annual Bird Report for the twelve months to June 2017.
Common, breeding resident/altitudinal migrant
Most of the birds of this species in the Canberra region are altitudinal migrants. Breeding seldom reported here.
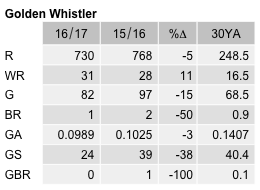
General: 1,326 birds recorded (last year 1,254) though well above the 10YA (598) and the 30YA (349). Recorded from 26% of grid cells (33% last year), in every week, with a lower proportion in summer (8%) than in autumn (31%), winter (29%) and spring (31%). Reporting rate is at its lowest level since systematic recording began, (5.3%) lower than last year (6.6%), the 10YA (7.7%) and the 30YA (9.1%). Max 18/12 Nov NNP–Warks/Blundells Creek Roads GrE15 (LaK1), mean 1.8, median 1. Abundance (0.0937) similar to last year (0.1072), though lower than the 10YA (0.1261) and the 30YA (0.1282). 2 breeding records (2 last year): dy/3 Jan NNP – Warks/Blundells Creek Roads GrE15 (SmA1) and di/5 Feb TNR – Mountain Ck Trails) GrF17 (ZwM1).
GBS: 254 birds recorded, similar to last year (298) though fewer than the 10YA (354), and the 30YA (383). 228 records, a little below last year (270), the 10YA (316) and the 30YA (330). Recorded in 40 weeks: autumn 44%, winter 35%, spring 20% and summer 1%. Records from 41% of sites (58% last year), a lower proportion than the 10YA (59%) and the 30YA (62%). Abundance about the same as last year and the 10YA (0.1105) though lower than the 30YA (0.1407). Max 4 (4 last year as well), mean 1.1, median 1. No breeding records (1 last year).
Abundance
Abundance is the average number of birds of that species per survey. Where the species was observed (presence recorded) but the number of birds seen was not recorded, this is treated as a count of zero.
Abundance by year
This chart shows the abundance of Golden Whistler between 1982 and 2017. 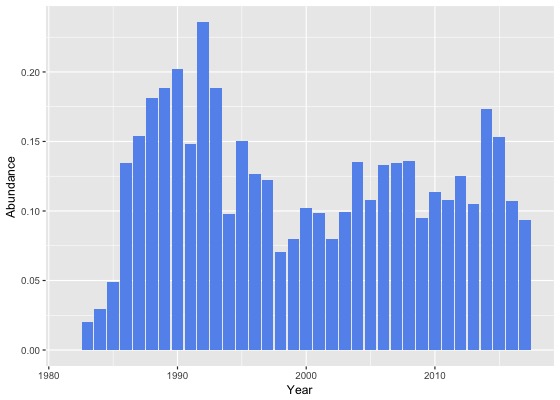
Abundance by month
This chart shows the monthly abundance of Golden Whistler. The blue lines show the abundance for the twelve months to June 2017 and the bars show the average abundance for the period 1982 to 2017. 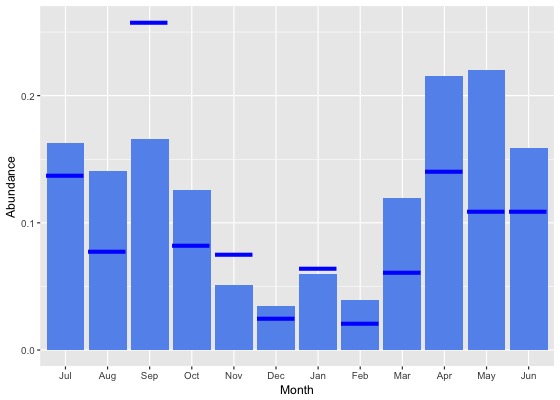
Abundance by season
This chart shows the seasonal abundance of Golden Whistler. The blue lines show the seasonal abundance for the twelve months to June 2017 and the bars show the average seasonal abundance for the period 1982 to 2017. 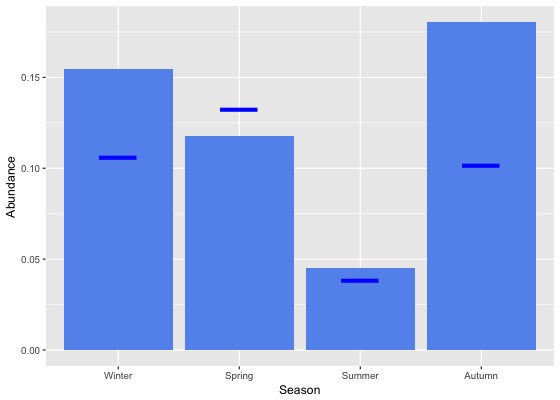
Abundance data
| Month | Season | ||||||||||||||||||
|---|---|---|---|---|---|---|---|---|---|---|---|---|---|---|---|---|---|---|---|
| Period | Jul | Aug | Sep | Oct | Nov | Dec | Jan | Feb | Mar | Apr | May | Jun | Winter | Spring | Summer | Autumn | All | ||
| All years | |||||||||||||||||||
| All | 0.2 | 0.1 | 0.2 | 0.1 | 0.1 | 0.0 | 0.1 | 0.0 | 0.1 | 0.2 | 0.2 | 0.2 | 0.2 | 0.1 | 0.0 | 0.2 | 0.1 | ||
| Previous years | |||||||||||||||||||
| All previous years | 0.2 | 0.2 | 0.2 | 0.1 | 0.0 | 0.0 | 0.1 | 0.0 | 0.1 | 0.2 | 0.2 | 0.2 | 0.2 | 0.1 | 0.0 | 0.2 | 0.1 | ||
| Previous 30 years | 0.2 | 0.2 | 0.2 | 0.1 | 0.0 | 0.0 | 0.1 | 0.0 | 0.1 | 0.2 | 0.2 | 0.2 | 0.2 | 0.1 | 0.0 | 0.2 | 0.1 | ||
| Previous 20 years | 0.2 | 0.1 | 0.2 | 0.1 | 0.0 | 0.0 | 0.0 | 0.0 | 0.1 | 0.2 | 0.2 | 0.2 | 0.2 | 0.1 | 0.0 | 0.2 | 0.1 | ||
| 10 year groups | |||||||||||||||||||
| [2007,2017) | 0.2 | 0.2 | 0.2 | 0.1 | 0.0 | 0.0 | 0.0 | 0.0 | 0.1 | 0.2 | 0.3 | 0.2 | 0.2 | 0.1 | 0.0 | 0.2 | 0.1 | ||
| [1997,2007) | 0.1 | 0.1 | 0.1 | 0.1 | 0.1 | 0.0 | 0.0 | 0.0 | 0.1 | 0.2 | 0.2 | 0.1 | 0.1 | 0.1 | 0.0 | 0.2 | 0.1 | ||
| [1987,1997) | 0.2 | 0.2 | 0.2 | 0.2 | 0.1 | 0.1 | 0.1 | 0.1 | 0.2 | 0.3 | 0.3 | 0.2 | 0.2 | 0.2 | 0.1 | 0.2 | 0.2 | ||
| 5 year groups | |||||||||||||||||||
| [2012,2017) | 0.2 | 0.2 | 0.1 | 0.1 | 0.0 | 0.0 | 0.0 | 0.0 | 0.2 | 0.3 | 0.3 | 0.2 | 0.2 | 0.1 | 0.0 | 0.2 | 0.1 | ||
| [2007,2012) | 0.2 | 0.2 | 0.2 | 0.1 | 0.0 | 0.0 | 0.1 | 0.1 | 0.1 | 0.2 | 0.2 | 0.1 | 0.2 | 0.1 | 0.0 | 0.2 | 0.1 | ||
| [2002,2007) | 0.1 | 0.1 | 0.2 | 0.1 | 0.0 | 0.0 | 0.0 | 0.0 | 0.1 | 0.2 | 0.2 | 0.1 | 0.1 | 0.1 | 0.0 | 0.2 | 0.1 | ||
| [1997,2002) | 0.1 | 0.1 | 0.1 | 0.1 | 0.1 | 0.0 | 0.1 | 0.1 | 0.1 | 0.2 | 0.2 | 0.1 | 0.1 | 0.1 | 0.0 | 0.1 | 0.1 | ||
| [1992,1997) | 0.1 | 0.1 | 0.1 | 0.3 | 0.1 | 0.0 | 0.2 | 0.0 | 0.1 | 0.2 | 0.3 | 0.2 | 0.1 | 0.1 | 0.1 | 0.2 | 0.2 | ||
| [1987,1992) | 0.2 | 0.2 | 0.2 | 0.2 | 0.1 | 0.1 | 0.1 | 0.1 | 0.2 | 0.3 | 0.3 | 0.2 | 0.2 | 0.2 | 0.1 | 0.3 | 0.2 | ||
| Year | |||||||||||||||||||
| 2017 | 0.1 | 0.1 | 0.3 | 0.1 | 0.1 | 0.0 | 0.1 | 0.0 | 0.1 | 0.1 | 0.1 | 0.1 | 0.1 | 0.1 | 0.0 | 0.1 | 0.1 | ||
| 2016 | 0.2 | 0.1 | 0.1 | 0.1 | 0.0 | 0.0 | 0.0 | 0.0 | 0.1 | 0.2 | 0.2 | 0.1 | 0.2 | 0.1 | 0.0 | 0.2 | 0.1 | ||
| 2015 | 0.2 | 0.3 | 0.2 | 0.2 | 0.0 | 0.1 | 0.0 | 0.0 | 0.1 | 0.3 | 0.3 | 0.2 | 0.2 | 0.1 | 0.0 | 0.2 | 0.2 | ||
| 2014 | 0.1 | 0.2 | 0.2 | 0.2 | 0.0 | 0.1 | 0.1 | 0.0 | 0.3 | 0.4 | 0.3 | 0.3 | 0.2 | 0.1 | 0.1 | 0.3 | 0.2 | ||
| 2013 | 0.2 | 0.1 | 0.1 | 0.1 | 0.0 | 0.0 | 0.0 | 0.0 | 0.1 | 0.2 | 0.3 | 0.1 | 0.1 | 0.1 | 0.0 | 0.2 | 0.1 | ||
| 2012 | 0.1 | 0.2 | 0.1 | 0.2 | 0.0 | 0.0 | 0.0 | 0.0 | 0.2 | 0.2 | 0.2 | 0.3 | 0.2 | 0.1 | 0.0 | 0.2 | 0.1 | ||
| 2011 | 0.3 | 0.2 | 0.2 | 0.1 | 0.0 | 0.0 | 0.0 | 0.0 | 0.1 | 0.2 | 0.1 | 0.1 | 0.2 | 0.1 | 0.0 | 0.1 | 0.1 | ||
| 2010 | 0.1 | 0.2 | 0.2 | 0.1 | 0.0 | 0.1 | 0.0 | 0.0 | 0.1 | 0.1 | 0.3 | 0.1 | 0.1 | 0.1 | 0.1 | 0.1 | 0.1 | ||
| 2009 | 0.1 | 0.1 | 0.2 | 0.1 | 0.0 | 0.0 | 0.1 | 0.1 | 0.1 | 0.1 | 0.2 | 0.1 | 0.1 | 0.1 | 0.0 | 0.1 | 0.1 | ||
| 2008 | 0.2 | 0.2 | 0.2 | 0.1 | 0.0 | 0.1 | 0.2 | 0.1 | 0.1 | 0.2 | 0.4 | 0.1 | 0.2 | 0.1 | 0.1 | 0.2 | 0.1 | ||
| 2007 | 0.1 | 0.1 | 0.1 | 0.2 | 0.0 | 0.0 | 0.0 | 0.1 | 0.2 | 0.2 | 0.4 | 0.2 | 0.2 | 0.1 | 0.0 | 0.2 | 0.1 | ||
| 2006 | 0.1 | 0.1 | 0.1 | 0.2 | 0.1 | 0.0 | 0.1 | 0.1 | 0.1 | 0.3 | 0.3 | 0.2 | 0.1 | 0.1 | 0.0 | 0.2 | 0.1 | ||
| 2005 | 0.2 | 0.1 | 0.1 | 0.1 | 0.0 | 0.0 | 0.1 | 0.0 | 0.0 | 0.2 | 0.2 | 0.2 | 0.2 | 0.1 | 0.0 | 0.2 | 0.1 | ||
| 2004 | 0.1 | 0.1 | 0.4 | 0.3 | 0.1 | 0.0 | 0.0 | 0.0 | 0.0 | 0.2 | 0.2 | 0.1 | 0.1 | 0.3 | 0.0 | 0.2 | 0.1 | ||
| 2003 | 0.2 | 0.1 | 0.1 | 0.0 | 0.0 | 0.0 | 0.0 | 0.0 | 0.2 | 0.3 | 0.3 | 0.1 | 0.1 | 0.1 | 0.0 | 0.2 | 0.1 | ||
| 2002 | 0.1 | 0.1 | 0.1 | 0.0 | 0.0 | 0.0 | 0.0 | 0.0 | 0.1 | 0.2 | 0.2 | 0.2 | 0.1 | 0.1 | 0.0 | 0.2 | 0.1 | ||
| 2001 | 0.2 | 0.1 | 0.1 | 0.1 | 0.0 | 0.0 | 0.0 | 0.1 | 0.1 | 0.1 | 0.3 | 0.1 | 0.1 | 0.1 | 0.0 | 0.1 | 0.1 | ||
| 2000 | 0.1 | 0.1 | 0.1 | 0.0 | 0.1 | 0.1 | 0.1 | 0.0 | 0.1 | 0.2 | 0.2 | 0.2 | 0.1 | 0.1 | 0.1 | 0.2 | 0.1 | ||
| 1999 | 0.1 | 0.0 | 0.1 | 0.1 | 0.2 | 0.0 | 0.1 | 0.0 | 0.0 | 0.1 | 0.1 | 0.1 | 0.1 | 0.1 | 0.1 | 0.1 | 0.1 | ||
| 1998 | 0.0 | 0.1 | 0.2 | 0.0 | 0.0 | 0.0 | 0.0 | 0.1 | 0.1 | 0.1 | 0.1 | 0.1 | 0.1 | 0.1 | 0.0 | 0.1 | 0.1 | ||
| 1997 | 0.0 | 0.1 | 0.1 | 0.1 | 0.0 | 0.0 | 0.2 | 0.0 | 0.2 | 0.4 | 0.2 | 0.1 | 0.1 | 0.1 | 0.0 | 0.3 | 0.1 | ||
| 1996 | 0.1 | 0.1 | 0.1 | 0.1 | 0.0 | 0.0 | 0.3 | 0.0 | 0.2 | 0.2 | 0.1 | 0.2 | 0.1 | 0.1 | 0.1 | 0.2 | 0.1 | ||
| 1995 | 0.2 | 0.1 | 0.1 | 0.2 | 0.1 | 0.1 | 0.2 | 0.0 | 0.1 | 0.1 | 0.3 | 0.3 | 0.2 | 0.1 | 0.1 | 0.2 | 0.2 | ||
| 1994 | 0.2 | 0.2 | 0.2 | 0.1 | 0.0 | 0.0 | 0.0 | 0.2 | 0.0 | 0.1 | 0.1 | 0.1 | 0.1 | 0.1 | 0.1 | 0.1 | 0.1 | ||
| 1993 | 0.1 | 0.2 | 0.1 | 0.1 | 0.1 | 0.0 | 0.7 | 0.0 | 0.2 | 0.3 | 0.3 | 0.2 | 0.2 | 0.1 | 0.3 | 0.3 | 0.2 | ||
| 1992 | 0.0 | 0.0 | 0.1 | 0.9 | 0.0 | 0.0 | 0.0 | 0.0 | 0.2 | 0.5 | 0.5 | 0.1 | 0.1 | 0.4 | 0.0 | 0.4 | 0.2 | ||
| 1991 | 0.1 | 0.2 | 0.1 | 0.1 | 0.1 | 0.0 | 0.1 | 0.1 | 0.1 | 0.5 | 0.2 | 0.2 | 0.2 | 0.1 | 0.0 | 0.3 | 0.1 | ||
| 1990 | 0.2 | 0.2 | 0.2 | 0.1 | 0.0 | 0.1 | 0.1 | 0.0 | 0.4 | 0.5 | 0.4 | 0.2 | 0.2 | 0.1 | 0.1 | 0.4 | 0.2 | ||
| 1989 | 0.2 | 0.2 | 0.2 | 0.2 | 0.1 | 0.1 | 0.1 | 0.1 | 0.2 | 0.3 | 0.2 | 0.2 | 0.2 | 0.2 | 0.1 | 0.2 | 0.2 | ||
| 1988 | 0.2 | 0.2 | 0.2 | 0.2 | 0.1 | 0.1 | 0.1 | 0.1 | 0.2 | 0.3 | 0.3 | 0.3 | 0.2 | 0.2 | 0.1 | 0.3 | 0.2 | ||
| 1987 | 0.2 | 0.1 | 0.2 | 0.1 | 0.1 | 0.1 | 0.1 | 0.1 | 0.1 | 0.2 | 0.2 | 0.2 | 0.2 | 0.1 | 0.1 | 0.2 | 0.2 | ||
| 1986 | 0.2 | 0.2 | 0.2 | 0.1 | 0.0 | 0.0 | 0.0 | 0.0 | 0.3 | 0.3 | 0.2 | 0.1 | 0.2 | 0.1 | 0.0 | 0.3 | 0.1 | ||
| 1985 | 0.1 | 0.0 | 0.1 | 0.1 | 0.0 | 0.0 | 0.0 | 0.1 | 0.1 | 0.1 | 0.2 | 0.0 | 0.1 | 0.0 | 0.0 | 0.1 | 0.0 | ||
| 1984 | 0.0 | 0.0 | 0.0 | 0.0 | 0.0 | 0.0 | 0.0 | 0.0 | 0.0 | 0.0 | 0.1 | 0.1 | 0.1 | 0.0 | 0.0 | 0.0 | 0.0 | ||
| 1983 | 0.0 | 0.0 | 0.0 | 0.1 | 0.1 | 0.0 | 0.0 | 0.0 | 0.0 | - | 0.0 | 0.0 | 0.0 | 0.1 | 0.0 | 0.0 | 0.0 | ||
| 1982 | - | 0.0 | - | 0.0 | 0.0 | 0.0 | - | 0.0 | - | 0.0 | - | 0.0 | 0.0 | 0.0 | 0.0 | 0.0 | 0.0 | ||
Reporting rates
Reporting rate is the proportion of all surveys in which the species was present.
Reporting rate by year
This chart shows the reporting rate of Golden Whistler each year between 1982 and 2017. 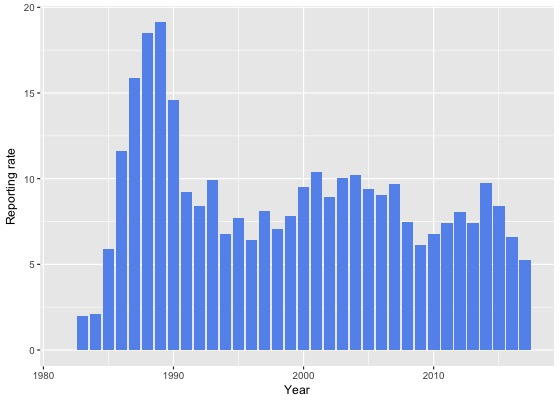
Reporting rate by month
This chart shows the reporting rate by month of Golden Whistler. The blue lines show the reporting rate for the twelve months to June 2017 and the bars show the average reporting rate for the period 1982 to 2017. 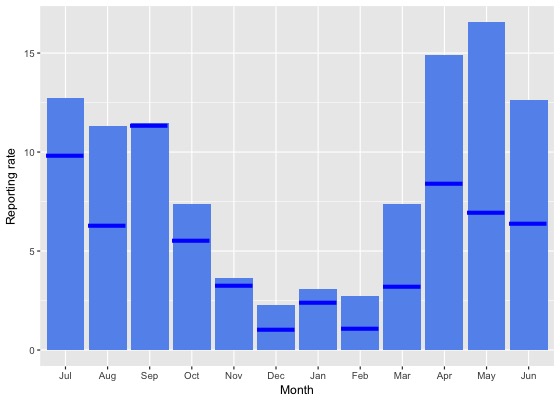
Reporting rate by season
This chart shows the seasonal reporting rate of Golden Whistler. The blue lines show the seasonal reporting rate for the twelve months to June 2017 and the bars show the average seasonal reporting rate for the period 1982 to 2017. 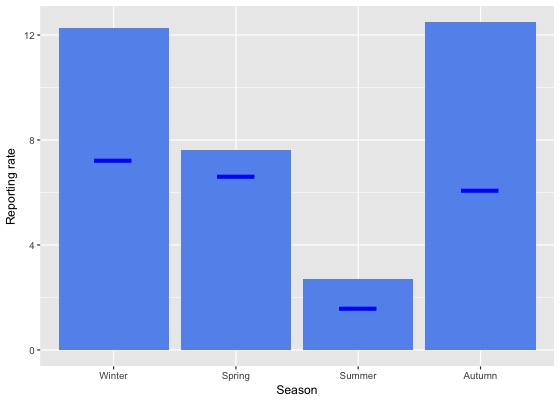
Reporting rate data
| Month | Season | ||||||||||||||||||
|---|---|---|---|---|---|---|---|---|---|---|---|---|---|---|---|---|---|---|---|
| Period | Jul | Aug | Sep | Oct | Nov | Dec | Jan | Feb | Mar | Apr | May | Jun | Winter | Spring | Summer | Autumn | All | ||
| All years | |||||||||||||||||||
| All | 12.7 | 11.3 | 11.5 | 7.4 | 3.6 | 2.3 | 3.1 | 2.7 | 7.4 | 14.9 | 16.5 | 12.6 | 12.2 | 7.6 | 2.7 | 12.5 | 8.5 | ||
| Previous years | |||||||||||||||||||
| All previous years | 13.2 | 12.3 | 11.5 | 7.6 | 3.7 | 2.4 | 3.2 | 3.1 | 8.1 | 16.0 | 18.8 | 13.8 | 13.2 | 7.8 | 2.9 | 13.7 | 9.1 | ||
| Previous 30 years | 13.3 | 12.4 | 11.5 | 7.7 | 3.7 | 2.5 | 3.2 | 3.1 | 8.1 | 16.0 | 18.8 | 13.9 | 13.3 | 7.8 | 2.9 | 13.7 | 9.1 | ||
| Previous 20 years | 12.5 | 11.0 | 10.5 | 6.9 | 2.5 | 1.6 | 2.5 | 2.4 | 7.4 | 15.1 | 17.9 | 12.8 | 12.2 | 7.0 | 2.1 | 12.8 | 8.2 | ||
| 10 year groups | |||||||||||||||||||
| [2007,2017) | 13.0 | 10.7 | 9.8 | 6.4 | 1.9 | 1.4 | 2.5 | 2.4 | 7.6 | 13.8 | 16.3 | 12.3 | 12.0 | 6.4 | 2.1 | 12.0 | 7.7 | ||
| [1997,2007) | 11.8 | 11.7 | 12.0 | 8.8 | 3.6 | 1.9 | 2.4 | 2.4 | 7.1 | 18.7 | 21.6 | 13.9 | 12.6 | 8.5 | 2.2 | 14.5 | 9.3 | ||
| [1987,1997) | 15.9 | 16.6 | 16.4 | 12.0 | 7.9 | 7.7 | 7.6 | 6.4 | 11.8 | 20.5 | 22.4 | 19.5 | 17.3 | 11.8 | 7.3 | 18.1 | 13.6 | ||
| 5 year groups | |||||||||||||||||||
| [2012,2017) | 13.2 | 10.5 | 9.4 | 6.7 | 1.8 | 1.3 | 2.3 | 2.1 | 7.9 | 15.2 | 16.3 | 12.9 | 12.2 | 6.3 | 2.0 | 12.6 | 7.8 | ||
| [2007,2012) | 12.3 | 11.3 | 10.5 | 5.9 | 2.2 | 1.6 | 3.2 | 3.6 | 6.7 | 10.5 | 16.6 | 11.2 | 11.5 | 6.5 | 2.6 | 10.5 | 7.5 | ||
| [2002,2007) | 12.1 | 11.3 | 13.3 | 9.5 | 3.8 | 1.6 | 2.1 | 2.0 | 6.2 | 20.6 | 22.1 | 12.9 | 12.2 | 9.2 | 1.8 | 14.8 | 9.5 | ||
| [1997,2002) | 11.2 | 12.1 | 10.5 | 7.8 | 3.4 | 2.3 | 2.9 | 2.9 | 8.3 | 16.4 | 20.9 | 15.2 | 13.2 | 7.5 | 2.7 | 14.2 | 9.0 | ||
| [1992,1997) | 8.3 | 8.3 | 8.4 | 5.8 | 3.7 | 2.1 | 4.6 | 2.2 | 7.7 | 11.4 | 16.8 | 12.5 | 9.8 | 5.8 | 3.1 | 11.7 | 7.7 | ||
| [1987,1992) | 19.3 | 21.0 | 20.2 | 15.4 | 9.9 | 10.1 | 9.3 | 8.1 | 14.3 | 25.7 | 25.2 | 23.4 | 21.2 | 14.8 | 9.2 | 21.7 | 16.6 | ||
| Year | |||||||||||||||||||
| 2017 | 9.8 | 6.3 | 11.4 | 5.6 | 3.3 | 1.1 | 2.4 | 1.1 | 3.2 | 8.4 | 7.0 | 6.4 | 7.2 | 6.6 | 1.6 | 6.1 | 5.3 | ||
| 2016 | 13.9 | 7.7 | 8.8 | 5.2 | 1.1 | 0.6 | 2.1 | 2.5 | 6.0 | 12.6 | 11.7 | 9.8 | 10.2 | 5.3 | 1.8 | 9.9 | 6.6 | ||
| 2015 | 13.5 | 15.7 | 11.0 | 7.3 | 2.8 | 1.1 | 2.0 | 1.8 | 7.3 | 14.5 | 19.3 | 12.4 | 13.6 | 7.2 | 1.7 | 13.2 | 8.4 | ||
| 2014 | 13.3 | 13.9 | 11.2 | 8.2 | 1.5 | 2.8 | 3.1 | 1.4 | 11.1 | 21.7 | 20.2 | 17.2 | 15.4 | 7.7 | 2.6 | 16.8 | 9.7 | ||
| 2013 | 14.1 | 8.6 | 10.1 | 6.5 | 2.3 | 1.9 | 2.1 | 2.6 | 7.9 | 14.9 | 19.2 | 10.8 | 11.1 | 6.4 | 2.1 | 12.8 | 7.4 | ||
| 2012 | 9.9 | 8.7 | 5.9 | 7.6 | 1.4 | 1.1 | 2.6 | 1.5 | 11.6 | 18.5 | 18.2 | 17.8 | 12.6 | 5.7 | 1.9 | 15.8 | 8.1 | ||
| 2011 | 21.1 | 15.2 | 12.8 | 5.9 | 0.6 | 1.2 | 2.1 | 1.4 | 7.8 | 11.3 | 10.5 | 9.6 | 13.2 | 6.9 | 1.6 | 9.8 | 7.4 | ||
| 2010 | 6.2 | 10.5 | 10.1 | 6.9 | 2.9 | 2.9 | 1.0 | 2.4 | 4.3 | 11.1 | 15.7 | 9.9 | 9.3 | 6.9 | 2.1 | 9.0 | 6.8 | ||
| 2009 | 6.5 | 10.4 | 7.5 | 5.3 | 2.7 | 0.5 | 3.3 | 4.2 | 6.5 | 7.0 | 13.0 | 9.9 | 9.0 | 5.3 | 2.4 | 8.1 | 6.1 | ||
| 2008 | 16.6 | 11.3 | 10.1 | 4.0 | 2.7 | 1.8 | 8.7 | 4.6 | 3.8 | 8.7 | 24.3 | 8.4 | 11.6 | 5.4 | 4.4 | 10.0 | 7.5 | ||
| 2007 | 8.8 | 8.3 | 12.4 | 7.9 | 2.0 | 1.3 | 3.5 | 7.0 | 10.2 | 15.0 | 27.6 | 16.9 | 13.6 | 8.2 | 3.1 | 15.7 | 9.7 | ||
| 2006 | 11.2 | 10.7 | 9.7 | 10.5 | 3.6 | 1.7 | 2.8 | 5.2 | 5.6 | 21.0 | 18.8 | 10.3 | 10.7 | 8.8 | 3.0 | 12.6 | 9.1 | ||
| 2005 | 14.0 | 8.4 | 8.9 | 7.2 | 4.1 | 1.6 | 5.0 | 2.2 | 4.8 | 18.0 | 20.4 | 14.5 | 13.1 | 7.2 | 2.7 | 13.8 | 9.4 | ||
| 2004 | 10.7 | 11.8 | 25.5 | 18.6 | 5.8 | 1.8 | 1.2 | 0.0 | 3.6 | 17.6 | 16.5 | 6.1 | 9.7 | 17.2 | 1.2 | 11.7 | 10.2 | ||
| 2003 | 15.4 | 12.2 | 11.4 | 4.7 | 2.3 | 1.7 | 0.7 | 1.1 | 10.8 | 24.0 | 29.5 | 14.3 | 13.9 | 6.3 | 1.3 | 20.0 | 10.1 | ||
| 2002 | 11.4 | 12.7 | 12.9 | 6.9 | 3.5 | 1.2 | 0.6 | 1.3 | 6.4 | 22.0 | 27.1 | 18.8 | 14.6 | 7.7 | 1.1 | 15.6 | 8.9 | ||
| 2001 | 14.2 | 16.3 | 10.1 | 10.5 | 2.8 | 2.9 | 2.0 | 2.6 | 8.1 | 14.6 | 27.2 | 19.2 | 16.5 | 8.5 | 2.5 | 14.6 | 10.4 | ||
| 2000 | 12.7 | 15.0 | 9.8 | 6.6 | 5.6 | 2.3 | 2.5 | 2.4 | 10.2 | 19.9 | 22.7 | 18.3 | 15.7 | 7.3 | 2.4 | 16.4 | 9.5 | ||
| 1999 | 11.8 | 5.2 | 9.2 | 6.9 | 2.6 | 2.5 | 4.4 | 4.3 | 4.9 | 13.9 | 14.8 | 11.7 | 9.9 | 6.4 | 3.7 | 11.2 | 7.8 | ||
| 1998 | 5.4 | 9.4 | 15.4 | 5.4 | 1.8 | 1.9 | 0.0 | 3.8 | 7.5 | 12.8 | 22.2 | 9.3 | 8.5 | 7.9 | 1.8 | 11.3 | 7.1 | ||
| 1997 | 3.4 | 6.9 | 10.0 | 7.9 | 2.6 | 1.0 | 7.8 | 1.8 | 15.0 | 18.3 | 15.6 | 12.5 | 7.4 | 6.6 | 2.8 | 17.0 | 8.1 | ||
| 1996 | 7.5 | 4.3 | 8.0 | 5.3 | 3.7 | 3.0 | 4.9 | 2.4 | 7.8 | 9.4 | 12.1 | 13.8 | 8.5 | 5.4 | 3.5 | 9.4 | 6.4 | ||
| 1995 | 7.5 | 7.8 | 4.9 | 5.5 | 4.5 | 3.4 | 6.2 | 1.6 | 7.1 | 9.7 | 18.2 | 18.1 | 10.8 | 5.0 | 4.2 | 11.0 | 7.7 | ||
| 1994 | 9.8 | 10.4 | 13.2 | 7.0 | 2.9 | 0.0 | 4.4 | 5.2 | 1.1 | 6.9 | 10.0 | 11.2 | 10.6 | 6.6 | 3.5 | 6.0 | 6.7 | ||
| 1993 | 12.2 | 14.1 | 9.7 | 5.3 | 6.1 | 2.2 | 6.1 | 0.0 | 12.3 | 13.3 | 18.2 | 10.1 | 12.2 | 6.9 | 3.1 | 14.7 | 9.9 | ||
| 1992 | 6.2 | 5.6 | 8.2 | 6.4 | 1.4 | 0.0 | 0.0 | 0.0 | 11.3 | 25.4 | 25.0 | 6.7 | 6.1 | 5.6 | 0.0 | 20.4 | 8.4 | ||
| 1991 | 9.4 | 12.8 | 11.6 | 5.8 | 5.2 | 2.7 | 1.8 | 4.0 | 6.3 | 27.1 | 13.1 | 14.0 | 11.4 | 7.3 | 2.8 | 15.3 | 9.2 | ||
| 1990 | 21.9 | 21.1 | 19.4 | 9.2 | 3.7 | 8.3 | 12.5 | 4.2 | 6.8 | 19.0 | 20.5 | 15.8 | 20.4 | 10.4 | 8.4 | 15.1 | 14.6 | ||
| 1989 | 23.5 | 22.8 | 25.3 | 18.5 | 14.1 | 13.0 | 10.6 | 9.8 | 15.6 | 27.2 | 25.0 | 25.0 | 23.7 | 19.5 | 11.3 | 22.6 | 19.1 | ||
| 1988 | 19.0 | 21.6 | 20.8 | 19.1 | 8.7 | 11.3 | 10.1 | 8.0 | 20.3 | 28.3 | 30.8 | 26.6 | 22.2 | 15.4 | 9.8 | 26.4 | 18.5 | ||
| 1987 | 27.3 | 33.3 | 18.2 | 14.8 | 11.9 | 9.0 | 8.2 | 8.8 | 12.9 | 24.3 | 25.3 | 24.0 | 24.8 | 14.7 | 8.7 | 21.1 | 15.9 | ||
| 1986 | 15.4 | 18.4 | 18.9 | 5.6 | 2.1 | 0.0 | 0.0 | 2.8 | 9.7 | 19.6 | 24.1 | 17.1 | 17.2 | 9.6 | 1.1 | 18.0 | 11.6 | ||
| 1985 | 3.3 | 3.3 | 7.7 | 4.7 | 0.0 | 0.0 | 0.0 | 5.9 | 18.2 | 21.1 | 40.0 | 10.7 | 5.7 | 4.1 | 1.2 | 25.0 | 5.9 | ||
| 1984 | 0.0 | 0.0 | 0.0 | 0.0 | 0.0 | 0.0 | 0.0 | 0.0 | 3.7 | 2.9 | 6.5 | 2.9 | 2.0 | 0.0 | 0.0 | 4.3 | 2.1 | ||
| 1983 | 0.0 | 0.0 | 0.0 | 7.7 | 11.1 | 0.0 | 0.0 | 0.0 | 0.0 | - | 0.0 | 0.0 | 0.0 | 7.4 | 0.0 | 0.0 | 2.0 | ||
| 1982 | - | 0.0 | - | 0.0 | 0.0 | 0.0 | - | 0.0 | - | 0.0 | - | 0.0 | 0.0 | 0.0 | 0.0 | 0.0 | 0.0 | ||
Breeding data
Breeding records by month
Number of breeding records by breeding code and month, 2017 and all years| Breeding code | Jul | Aug | Sep | Oct | Nov | Dec | Jan | Feb | Mar | Apr | May | Jun |
|---|---|---|---|---|---|---|---|---|---|---|---|---|
| 2017 | ||||||||||||
| Breeding (BLA code) | 0 | 0 | 0 | 0 | 0 | 0 | 0 | 0 | 0 | 0 | 0 | 0 |
| Carrying Food | 0 | 0 | 0 | 0 | 0 | 0 | 0 | 0 | 0 | 0 | 0 | 0 |
| Copulating | 0 | 0 | 0 | 0 | 0 | 0 | 0 | 0 | 0 | 0 | 0 | 0 |
| Display | 0 | 0 | 0 | 0 | 0 | 0 | 0 | 1 | 0 | 0 | 0 | 0 |
| Dependent young | 0 | 0 | 0 | 0 | 0 | 0 | 1 | 0 | 0 | 0 | 0 | 0 |
| Faecal sac | 0 | 0 | 0 | 0 | 0 | 0 | 0 | 0 | 0 | 0 | 0 | 0 |
| Inspecting hollow | 0 | 0 | 0 | 0 | 0 | 0 | 0 | 0 | 0 | 0 | 0 | 0 |
| Nest building | 0 | 0 | 0 | 0 | 0 | 0 | 0 | 0 | 0 | 0 | 0 | 0 |
| Nest with eggs | 0 | 0 | 0 | 0 | 0 | 0 | 0 | 0 | 0 | 0 | 0 | 0 |
| Nest with young | 0 | 0 | 0 | 0 | 0 | 0 | 0 | 0 | 0 | 0 | 0 | 0 |
| On/leaving nest | 0 | 0 | 0 | 0 | 0 | 0 | 0 | 0 | 0 | 0 | 0 | 0 |
| All years | ||||||||||||
| Breeding (BLA code) | 0 | 0 | 0 | 2 | 0 | 1 | 2 | 0 | 0 | 0 | 0 | 0 |
| Carrying Food | 0 | 0 | 0 | 0 | 0 | 2 | 0 | 0 | 0 | 0 | 0 | 0 |
| Copulating | 0 | 0 | 0 | 0 | 0 | 0 | 0 | 0 | 0 | 1 | 0 | 0 |
| Display | 0 | 1 | 0 | 0 | 0 | 0 | 0 | 1 | 0 | 0 | 0 | 0 |
| Dependent young | 0 | 0 | 0 | 0 | 0 | 1 | 5 | 4 | 1 | 0 | 0 | 0 |
| Faecal sac | 0 | 0 | 0 | 0 | 0 | 0 | 0 | 0 | 0 | 0 | 0 | 0 |
| Inspecting hollow | 0 | 0 | 0 | 0 | 0 | 0 | 0 | 0 | 0 | 0 | 0 | 0 |
| Nest building | 0 | 0 | 1 | 2 | 0 | 0 | 0 | 0 | 0 | 1 | 0 | 0 |
| Nest with eggs | 0 | 1 | 0 | 0 | 0 | 0 | 0 | 0 | 0 | 0 | 0 | 0 |
| Nest with young | 0 | 0 | 0 | 0 | 0 | 0 | 1 | 0 | 0 | 0 | 0 | 0 |
| On/leaving nest | 0 | 1 | 0 | 1 | 0 | 0 | 0 | 0 | 0 | 0 | 0 | 0 |
Breeding records by year
Average number of breeding records per period by breeding code| Period | Breeding (BLA code) | Carrying Food | Copulating | Display | Dependent young | Faecal sac | Inspecting hollow | Nest building | Nest with eggs | Nest with young | On/leaving nest |
|---|---|---|---|---|---|---|---|---|---|---|---|
| All years | |||||||||||
| All | 0.1 | 0.1 | 0.0 | 0.1 | 0.3 | 0.0 | 0.0 | 0.1 | 0.0 | 0.0 | 0.1 |
| Previous years | |||||||||||
| All previous years | 0.1 | 0.1 | 0.0 | 0.0 | 0.3 | 0.0 | 0.0 | 0.1 | 0.0 | 0.0 | 0.1 |
| Previous 30 years | 0.2 | 0.1 | 0.0 | 0.0 | 0.3 | 0.0 | 0.0 | 0.1 | 0.0 | 0.0 | 0.1 |
| Previous 20 years | 0.2 | 0.0 | 0.0 | 0.0 | 0.3 | 0.0 | 0.0 | 0.0 | 0.0 | 0.0 | 0.0 |
| 10 year groups | |||||||||||
| [2007,2017) | 0.4 | 0.0 | 0.1 | 0.0 | 0.6 | 0.0 | 0.0 | 0.1 | 0.0 | 0.0 | 0.0 |
| [1997,2007) | 0.1 | 0.0 | 0.0 | 0.0 | 0.0 | 0.0 | 0.0 | 0.0 | 0.0 | 0.0 | 0.1 |
| [1987,1997) | 0.0 | 0.2 | 0.0 | 0.1 | 0.4 | 0.0 | 0.0 | 0.3 | 0.1 | 0.1 | 0.1 |
| 5 year groups | |||||||||||
| [2012,2017) | 0.6 | 0.0 | 0.2 | 0.0 | 0.6 | 0.0 | 0.0 | 0.0 | 0.0 | 0.0 | 0.0 |
| [2007,2012) | 0.2 | 0.0 | 0.0 | 0.0 | 0.6 | 0.0 | 0.0 | 0.2 | 0.0 | 0.0 | 0.0 |
| [2002,2007) | 0.0 | 0.0 | 0.0 | 0.0 | 0.0 | 0.0 | 0.0 | 0.0 | 0.0 | 0.0 | 0.2 |
| [1997,2002) | 0.2 | 0.0 | 0.0 | 0.0 | 0.0 | 0.0 | 0.0 | 0.0 | 0.0 | 0.0 | 0.0 |
| [1992,1997) | 0.0 | 0.0 | 0.0 | 0.2 | 0.0 | 0.0 | 0.0 | 0.0 | 0.0 | 0.2 | 0.0 |
| [1987,1992) | 0.0 | 0.4 | 0.0 | 0.0 | 0.8 | 0.0 | 0.0 | 0.6 | 0.2 | 0.0 | 0.2 |
| Year | |||||||||||
| 2017 | 0.0 | 0.0 | 0.0 | 1.0 | 1.0 | 0.0 | 0.0 | 0.0 | 0.0 | 0.0 | 0.0 |
| 2016 | 0.0 | 0.0 | 0.0 | 0.0 | 2.0 | 0.0 | 0.0 | 0.0 | 0.0 | 0.0 | 0.0 |
| 2015 | 0.0 | 0.0 | 0.0 | 0.0 | 1.0 | 0.0 | 0.0 | 0.0 | 0.0 | 0.0 | 0.0 |
| 2014 | 1.0 | 0.0 | 0.0 | 0.0 | 0.0 | 0.0 | 0.0 | 0.0 | 0.0 | 0.0 | 0.0 |
| 2013 | 0.0 | 0.0 | 0.0 | 0.0 | 0.0 | 0.0 | 0.0 | 0.0 | 0.0 | 0.0 | 0.0 |
| 2012 | 2.0 | 0.0 | 1.0 | 0.0 | 0.0 | 0.0 | 0.0 | 0.0 | 0.0 | 0.0 | 0.0 |
| 2011 | 0.0 | 0.0 | 0.0 | 0.0 | 0.0 | 0.0 | 0.0 | 0.0 | 0.0 | 0.0 | 0.0 |
| 2010 | 0.0 | 0.0 | 0.0 | 0.0 | 0.0 | 0.0 | 0.0 | 0.0 | 0.0 | 0.0 | 0.0 |
| 2009 | 0.0 | 0.0 | 0.0 | 0.0 | 0.0 | 0.0 | 0.0 | 1.0 | 0.0 | 0.0 | 0.0 |
| 2008 | 0.0 | 0.0 | 0.0 | 0.0 | 3.0 | 0.0 | 0.0 | 0.0 | 0.0 | 0.0 | 0.0 |
| 2007 | 1.0 | 0.0 | 0.0 | 0.0 | 0.0 | 0.0 | 0.0 | 0.0 | 0.0 | 0.0 | 0.0 |
| 2006 | 0.0 | 0.0 | 0.0 | 0.0 | 0.0 | 0.0 | 0.0 | 0.0 | 0.0 | 0.0 | 0.0 |
| 2005 | 0.0 | 0.0 | 0.0 | 0.0 | 0.0 | 0.0 | 0.0 | 0.0 | 0.0 | 0.0 | 1.0 |
| 2004 | 0.0 | 0.0 | 0.0 | 0.0 | 0.0 | 0.0 | 0.0 | 0.0 | 0.0 | 0.0 | 0.0 |
| 2003 | 0.0 | 0.0 | 0.0 | 0.0 | 0.0 | 0.0 | 0.0 | 0.0 | 0.0 | 0.0 | 0.0 |
| 2002 | 0.0 | 0.0 | 0.0 | 0.0 | 0.0 | 0.0 | 0.0 | 0.0 | 0.0 | 0.0 | 0.0 |
| 2001 | 0.0 | 0.0 | 0.0 | 0.0 | 0.0 | 0.0 | 0.0 | 0.0 | 0.0 | 0.0 | 0.0 |
| 2000 | 1.0 | 0.0 | 0.0 | 0.0 | 0.0 | 0.0 | 0.0 | 0.0 | 0.0 | 0.0 | 0.0 |
| 1999 | 0.0 | 0.0 | 0.0 | 0.0 | 0.0 | 0.0 | 0.0 | 0.0 | 0.0 | 0.0 | 0.0 |
| 1998 | 0.0 | 0.0 | 0.0 | 0.0 | 0.0 | 0.0 | 0.0 | 0.0 | 0.0 | 0.0 | 0.0 |
| 1997 | 0.0 | 0.0 | 0.0 | 0.0 | 0.0 | 0.0 | 0.0 | 0.0 | 0.0 | 0.0 | 0.0 |
| 1996 | 0.0 | 0.0 | 0.0 | 1.0 | 0.0 | 0.0 | 0.0 | 0.0 | 0.0 | 0.0 | 0.0 |
| 1995 | 0.0 | 0.0 | 0.0 | 0.0 | 0.0 | 0.0 | 0.0 | 0.0 | 0.0 | 1.0 | 0.0 |
| 1994 | 0.0 | 0.0 | 0.0 | 0.0 | 0.0 | 0.0 | 0.0 | 0.0 | 0.0 | 0.0 | 0.0 |
| 1993 | 0.0 | 0.0 | 0.0 | 0.0 | 0.0 | 0.0 | 0.0 | 0.0 | 0.0 | 0.0 | 0.0 |
| 1992 | 0.0 | 0.0 | 0.0 | 0.0 | 0.0 | 0.0 | 0.0 | 0.0 | 0.0 | 0.0 | 0.0 |
| 1991 | 0.0 | 0.0 | 0.0 | 0.0 | 0.0 | 0.0 | 0.0 | 0.0 | 0.0 | 0.0 | 0.0 |
| 1990 | 0.0 | 0.0 | 0.0 | 0.0 | 0.0 | 0.0 | 0.0 | 0.0 | 0.0 | 0.0 | 0.0 |
| 1989 | 0.0 | 2.0 | 0.0 | 0.0 | 1.0 | 0.0 | 0.0 | 0.0 | 1.0 | 0.0 | 1.0 |
| 1988 | 0.0 | 0.0 | 0.0 | 0.0 | 2.0 | 0.0 | 0.0 | 2.0 | 0.0 | 0.0 | 0.0 |
| 1987 | 0.0 | 0.0 | 0.0 | 0.0 | 1.0 | 0.0 | 0.0 | 1.0 | 0.0 | 0.0 | 0.0 |
| 1986 | 0.0 | 0.0 | 0.0 | 0.0 | 0.0 | 0.0 | 0.0 | 0.0 | 0.0 | 0.0 | 0.0 |
| 1985 | 0.0 | 0.0 | 0.0 | 0.0 | 0.0 | 0.0 | 0.0 | 0.0 | 0.0 | 0.0 | 0.0 |
| 1984 | 0.0 | 0.0 | 0.0 | 0.0 | 0.0 | 0.0 | 0.0 | 0.0 | 0.0 | 0.0 | 0.0 |
| 1983 | 0.0 | 0.0 | 0.0 | 0.0 | 0.0 | 0.0 | 0.0 | 0.0 | 0.0 | 0.0 | 0.0 |
| 1982 | 0.0 | 0.0 | 0.0 | 0.0 | 0.0 | 0.0 | 0.0 | 0.0 | 0.0 | 0.0 | 0.0 |
Distribution map
Distribution - 2017
This map shows the observed distribution of the Golden Whistler for 2017.
The red circles are the grid cells where Golden Whistler have been reported.
The transparency of the red circles indicate how many surveys sheets were submitted for that grid cell; the darker the red the more reliable the data. Of the 315 grid cells with reports, 83 had only one sheet; an example is grid number J3.
The size of the circle represents the reporting rate. The maximum reporting rate for Golden Whistler was 100.0% (eg grid number J3) and the minimum was 0.4% (eg grid number S13). 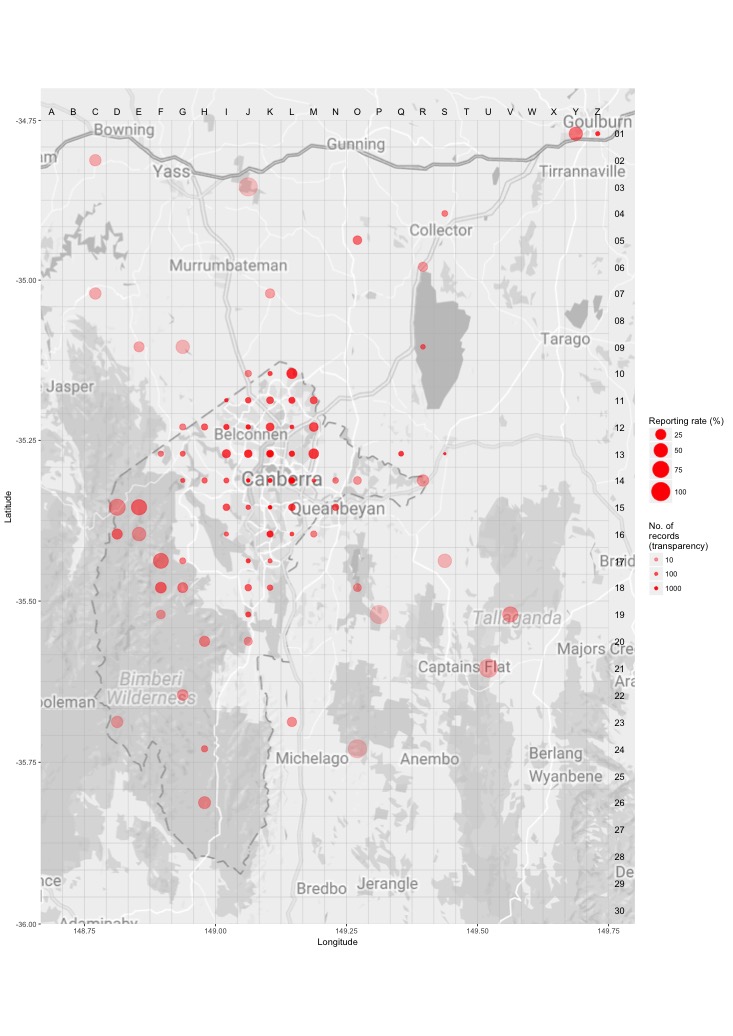
Distribution - all years
This map shows the observed distribution of the Golden Whistler for all years.
The red circles are the grid cells where Golden Whistler have been reported.
The transparency of the red circles indicate how many surveys sheets were submitted for that grid cell; the darker the red the more reliable the data. Of the 703 grid cells with reports, 55 had only one sheet; an example is grid number C10.
The size of the circle represents the reporting rate. The maximum reporting rate for Golden Whistler was 100.0% (eg grid number B15) and the minimum was 0.2% (eg grid number S13). 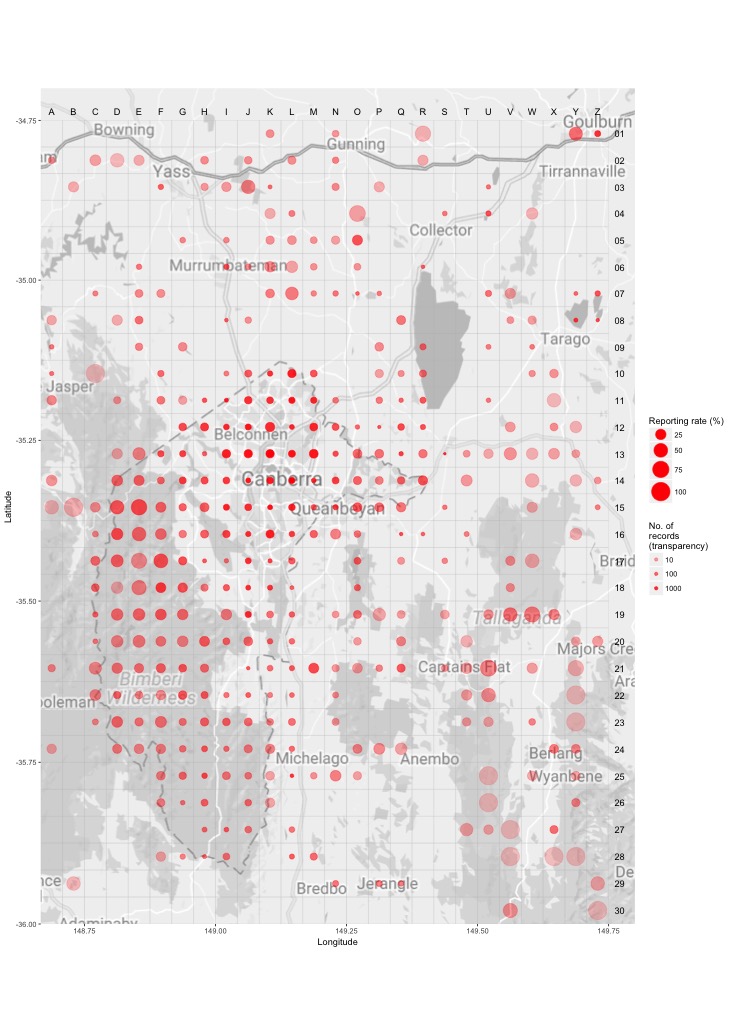
Breeding map
Breeding - 2017
This map shows the breeding distribution of the Golden Whistler for 2017.
The red circles are the grid cells where breeding activity for Golden Whistler have been reported.
The size of the circle represents the number of reports. 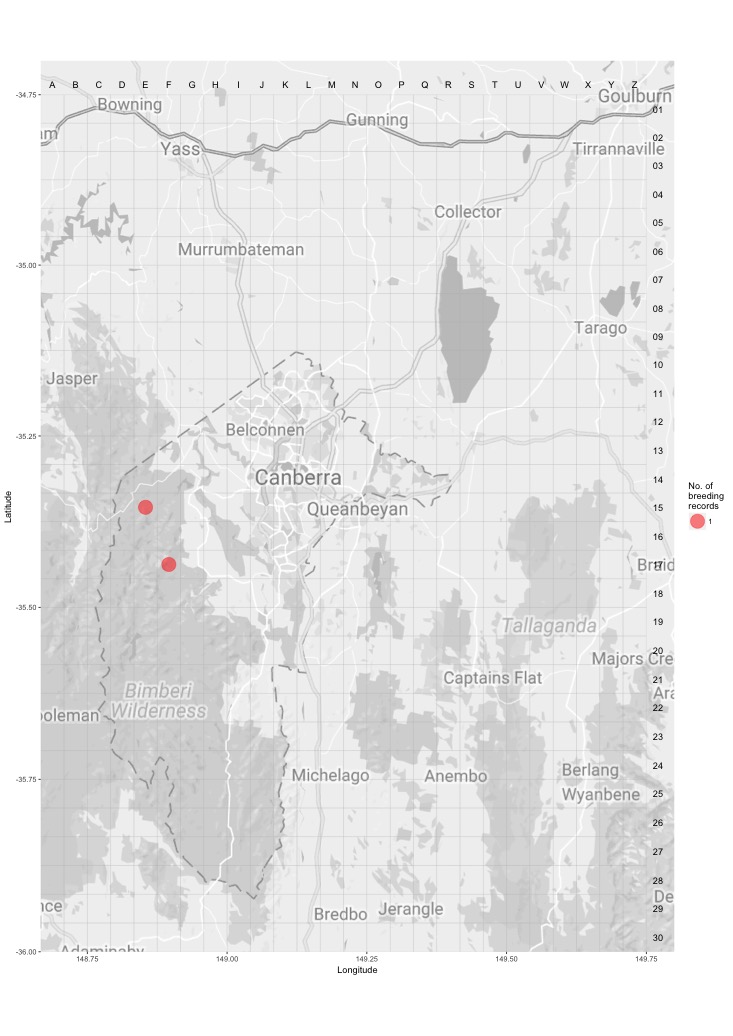
Breeding - all years
This map shows the breeding distribution of the Golden Whistler for all years.
The red circles are the grid cells where breeding activity for Golden Whistler have been reported.
The size of the circle represents the number of reports. 